The rules of measuring a website have been rewritten. Just five years back, the traffic graph was used to find who ranked where in the month. This chart does not tell you much by itself in 2026. Search results respond to questions before anyone has a click, AI tools summarize your content in their feed without sending a visitor, and buyers arrive later in their journey with better intent.
What matters now is what happens after the landing: who stays, who acts, and who pays. As a web design company Mississauga businesses trust to turn visits into revenue, we treat the website as the honest ledger of digital performance. Every campaign, post, and ranking either shows up there as growth or it leaks away.
The 10 KPIs below help you see which one is happening, and connect your marketing spend to outcomes you can take to the bank.
Understanding Key Performance Indicators (KPIs) in the Digital Age
A KPI is a number with a consequence. When it changes, something about your sales, your pipeline, or your audience changes with it. Follower counts and raw page views rarely pass that test. Useful website performance metrics always do.
Businesses that keep growing share a simple habit. They track fewer numbers, look at them on a fixed day each month, and change something when a trend turns. That rhythm turns website performance optimization into ordinary maintenance rather than a rescue mission.
The Best Essential Website KPIs for Predicting Business Growth
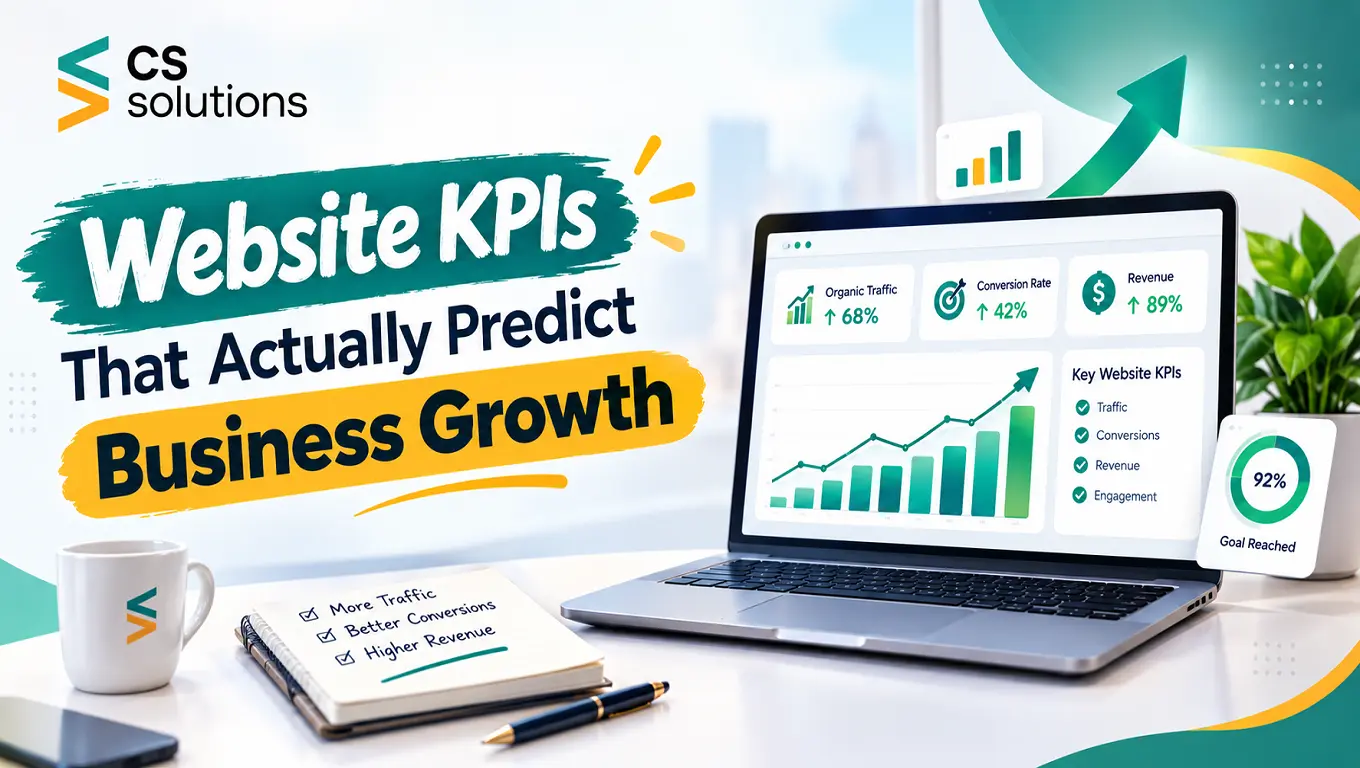
Whether you just launched a startup and are busy finding your footing, working to scale your mid-sized business, or growing an enterprise with multiple sites you need to keep an eye on the following ten website KPIs.
1. Organic Search Traffic
Organic traffic counts the people who reach you through unpaid search. They came looking, which makes this one of the most trustworthy growth signals you have. And, a smooth upward road indicates the market is discovering you by itself. Monitor it in GA4 and Search Console, develop it with more in-depth content and true topical authority.
2. SEO Rankings
Rankings show where your pages sit for the searches buyers actually type. Where you rank decides visibility and visibility drives clicks. As an example, a simple list of SEO KPIs for 2026: Target position of keywords, the percentage of terms in the top ten movements from month to month. Slipping positions tend to show up weeks before traffic does.
3. Sales & Revenue
Revenue is the number every other number answers to. Once website activity is tied to closed sales, you have data-driven revenue reporting that shows which pages and channels actually pay for themselves. Budget conversations get a lot shorter when that evidence is on the screen.
4. Traffic Sources
Where visitors arrived from will instruct you on where to smartly put your time. Analyze volume and conversion rate for organic, paid, social, referral, and direct channels of traffic. The common pattern found from studies about how online stores can send organic traffic is simple: search sends less traffic than social, but many, many more of them purchase.
5. Pages Per Session
This counts how many pages a visitor views in one sitting. Higher figures mean people are finding related content and going deeper. A 100-page analysis of your most visited URLs shows which internal links keep people exploring and which pages send them away. Fix the exits first.
6. Duration of Visit
Time on site shows whether your content holds attention. GA4 reports it as average engagement time, and one to two minutes is healthy for most sites. Short visits on important pages point to slow loading, a cluttered layout, or a page that promised one thing in search and delivered another.
7. Average Order Value (AOV)
AOV is total revenue divided by orders. Raising it grows income without winning a single new customer. It pushes it up into bundles, cross-sells and free shipping thresholds, for example; as AOV rises, you have more leeway to spend on acquisition.
8. Key Events / Conversions
Key events are the actions you have decided matter: purchases, forms, calls, downloads. GA4 records each one as an event, so you choose what counts. Reporting on these instead of visits keeps the team focused on outcomes, which is the whole reason the website exists.
9. Key Event / Conversion Rate
Conversion rate is key events divided by sessions. It gives the clearest reading of website conversion and ROI because it shows how efficiently attention becomes results. Most industries sit between two and three percent, and one extra point can double returns on the same spend.
10. Bounce Rate
Website bounce rate is the share of visitors who leave after one page. GA4 now frames it as the inverse of engagement rate. Often, the bounce on homes is the result of slow loading, a lack of clarity of layout, or answering the user problem that takes too long.
Conclusions
At CS Web Solutions, we build websites that are measurable from day one, and we believe every owner deserves to read their own numbers with confidence. More than filling a monthly report, these ten KPIs, starting with organic traffic and rankings through conversion rate, AOV, or bounce rate, narrate the story of your business. They tell you where demand is coming from, where attention is converting to revenue, and where money is being bled dry.
Treat them as your early warning system. A dip in rankings today is a dip in enquiries next month. A single extra point of conversion rate can double the return on the same ad spend. When you review these figures on a fixed day each month, growth stops being a surprise and starts being a plan.
Build smart, measure smart, and watch your business grow predictably. As a web development company Mississauga businesses have relied on since 2010, we help startups, growing businesses and enterprise level organizations turn data into decisions. Book a free consultation with CS Web Solutions today and let us show you which numbers deserve your attention first.
Frequently Asked Questions
What are website KPIs?
Metrics that can be concretely measured to indicate the extent to which your site supports business objectives, e.g., conversion rate, organic traffic volume, revenue.
What is AI visibility and why should I care?
The amount of times your brand appears in AI generated responses from applications such as Google AI Overviews over a timespan, or even ChatGPT and the result of more searches terminating without a click.
How often should I review my website KPIs?
Monthly at least, weekly on active campaigns, and quarterly for longer-term web design trends.
What is the most important website KPI to track?
Conversion rate, as it's a sign of how well you're able to convert people who come to your site page and become leads or customers.
How has GA4 changed the way we measure website KPIs?
GA4 tracks everything as an event, replacing older session-based measures with engaged sessions and engagement rate.